|
|

|
Draft Script
Slide BG-1 (Barbara Giles)
....
reconstretched.mpg
?? minutes
Good Afternoon and thank you for coming. Today we want to tell you about large-scale disturbances that form in the Earth's ionosphere during space storms. Space weather observers know that when these disturbances pass overhead, they impede radio communications and delay GPS navigation signals. Several presentations on these ionospheric disruptions, supported by NASA and the National Science Foundation, will be presented today and tomorrow during the łStorms in Geospace˛ sessions at this meeting.
Let me set the stage for you today by showing you an animation of a space storm event and how explosions on the sun can affect our Earth's near space environment.
Loop video #1:
reconstretched.mpg
[get time-stretched version from Walt Feimer]
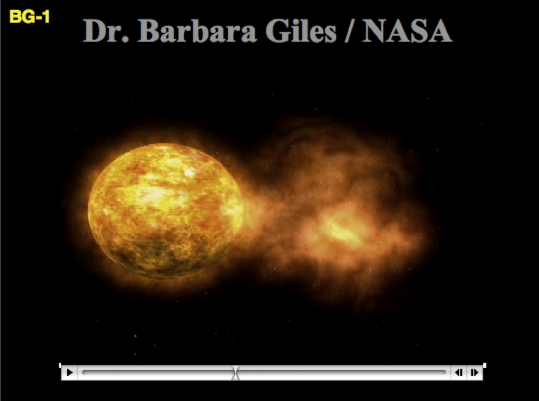
Our solar system has the cosmic equivalent of winds, clouds, storms, and hurricanes; we call it space weather. Just like weather on Earth, it can be both mild and wild. It is as changeable as the everyday weather we experience outside Š but is windier than on a mountain peak and as electric as a city night.
Solar flares often result in violent explosions called Coronal Mass Ejections, or CMEs. When such CMEs are directed toward the earth, turbulent shock waves of charged gas and their accompanying magnetic fields impact our Earth's protective layer, called the magnetosphere.
These impacts in turn cause storms within our magnetosphere that - as you will come to understand today - can interfere with radio, television, and telephone signals, damage satellites and disrupt GPS communications. In September a class X17 solar flare created a blackout of high-frequency radio communications on the entire sunlit side of the Earth, temporarily disrupting a variety of communications, including those used by relief teams responding to Hurricane Katrina.
Everyone in our new technically capable society has become intimately connected with such weather conditions that extend far out into space. To tell us about how these storms form and evolve, we have Š
Dr. Jerry Goldstein of the Southwest Research Institute in San Antonio, Texas. Dr. Goldstein is one of a group of scientists that have recently stirred up great interest in a cold zone around our Earth that will turn out to be instrumental in allowing these space storms to directly affect our lives on Earth.
Then we will hear from Dr. Anthea Coster of MIT's Haystack Observatory. Dr. Coster is one of our country's leading experts on the physics of the ionosphere and how disturbances there are created and then evolve.
Last, we want to hear from Dr. Anthony Mannucci of NASA's Jet Propulsion Laboratory. Dr. Mannucci is an expert on Space Weather and how space weather affects our nation's communication and other technologies.
Let's start with understanding what, exactly, happens to the Earth's near space environment during these storms. Jerry, would you please start by telling us how storms from the sun, such the one in the visualization we just saw, sets the stage for what happens in our Earth's ionosphere.
Slide JG-1 (Jerry Goldstein)
....
plasmatour_640x480.mpg
45-60 seconds
To understand the effect of space storms, first we need to know a little bit about the Earth's space environment.
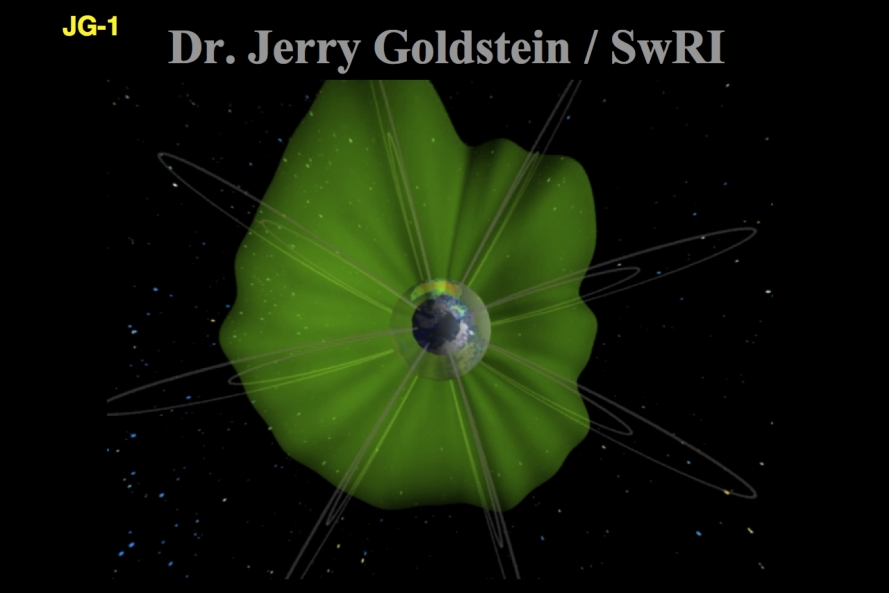
The near-Earth space environment is not a perfect vacuum, but rather is filled with plasma, or ionized gas. Plasma is formed when the upper parts of the Earth's atmosphere are electrified by the Sun's ultraviolet rays.
The plasmasphere is a doughnut-shaped region of ionized gas, or plasma. In this animation, the plasmasphere is the green region surrounding the Earth. The viewpoint of the animation varies from above the North pole to below the South pole of the Earth, and shows the 3D shape of the plasmasphere. As you can see from the animation, the outer boundary of the plasmasphere, which we call the plasmapause, mostly follows the Earth's magnetic field lines, which are drawn in gray here.
Slide JG-2
....
2-panelA.JPG
45 seconds
How do we know what the plasmasphere looks like?
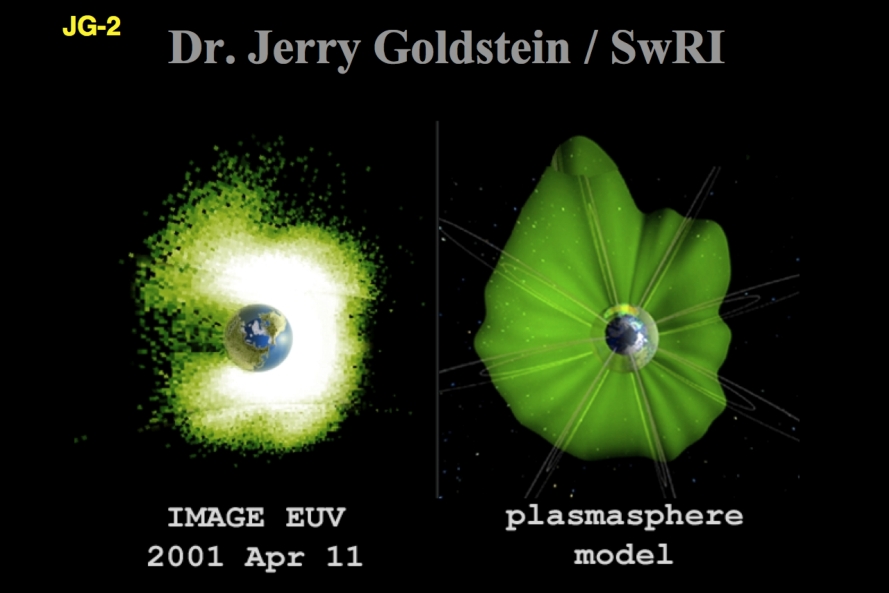
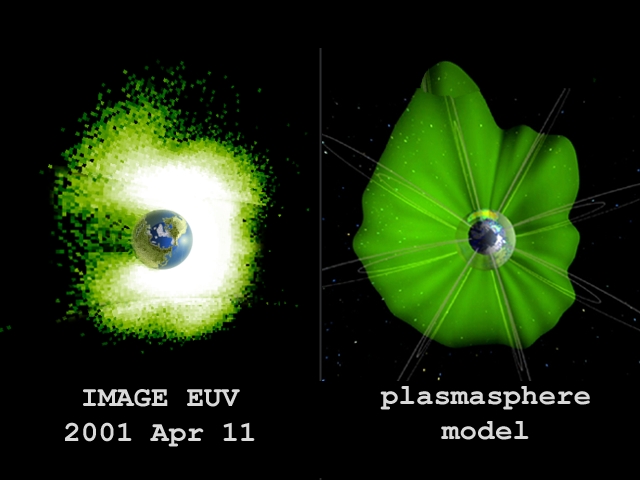
The left panel shows an image of the plasmasphere obtained by the NASA satellite called IMAGE. The plasmasphere emits a glow in the ultraviolet range of the electromagnetic spectrum. Cameras onboard the IMAGE satellite are able to capture this ultraviolet glow, producing the false-color picture you see. The plasmasphere is the green-to-white region surrounding the Earth.
The right panel of this slide shows a single snapshot from the animation you just saw, which was a model based on the data shown in the left panel.
So this is the plasmasphere as it was on April 11th 2001.
Slide JG-3

....
2-panelB.JPG
2 minutes, 15 seconds.
On April 11th 2001, the plasmasphere was hit by what we call a space storm. A space storm is a large electromagnetic disturbance that sweeps past the Earth and has a profound effect on the plasmas in Earth's space environment. Just as storms on Earth can cause erosion of coastlines, storms in space can cause erosion of the outermost part of the plasmasphere.
Because of this similarity between Earth storms and space storms, we call this area of study "space weather".
The IMAGE satellite witnessed a 30 percent plasmaspheric erosion, caused by the April 11th storm. This slide shows before and after snapshots obtained by IMAGE, which monitored the global effects of space weather on this day.
On the left, you see the plasmasphere before the storm. It is irregularly shaped and large, with a diameter 6 to 10 times that of the Earth, reaching roughly 13 to 26 thousand kilometers above the Earth's surface.
On the right you see the plasmasphere after the storm. The space storm eroded away the outer layers of the plasmasphere, making it about 30 percent smaller. So this space weather event had a large impact on the plasmasphere.
Before global imaging, we had to rely on a large number of single satellite measurements to try to figure out
what happens to the plasmasphere during space weather events.
This is a very difficult way to learn about space weather. It's equivalent to trying to map out
a cold weather front on Earth by driving across the United States while holding
a thermometer outside the car window.
Trying to do this, you could never be sure that the cold front didn't move in the time between your
measurements.
What you really want is the satellite image of the weather fronts, that allows you to see the big picture,
and understand how local weather conditions arise from large-scale atmospheric changes.
Similarly, what we have had since the launch of the NASA IMAGE satellite, in March 2000, is the capability to
see the space weather equivalent to cold fronts: the formation of large-scale plasmaspheric plumes
in response to space storms. And thanks to this relatively new capability, our models for the effects
of space weather have been dramatically improved.
The process of plasmaspheric erosion is something we understand well enough to predict with our best models.
Slide JG-4

....
FieldLineMapEarthmov.mov
45 seconds
When the space storm hits the plasmasphere, it strips away the outer layers, forming a huge plume of eroded plasma that stretches sunward. The plasmaspheric plume carries mass away from the plasmasphere at a rate of about 36 metric tons per hour! Of course, this material is spread thinly through a volume of space of about 20 billion cubic kilometers!
Our models tell us that during space storms, plasma is pulled sunward on the dayside.
This animation shows a side view of the Earth.
The Earth's magnetic field is represented by the curved gray lines.
The green regions show a side view (that is, a cross section) of the doughnut-shaped plasmasphere.
The effect of a space storm is to pull the plasma sunward on the dayside.
As a large volume of plasma is pulled sunward,
it maintains its doughnut shape, following the magnetic geometry.
You can see that because of the magnetic geometry,
as the plasma is dragged sunward, the footpoint of the magnetic field line
that passes through the plasma, is actually dragged to higher latitudes.
Slide JG-5

....
3D-euv-tec-640x480.JPG
45 seconds
You just saw how when the plasmaspheric plasma moves sunward, this maps to ionospheric plasma moving to higher
latitudes.
The plasmaspheric plume, which forms during space storms, is the thin "strand" of material that stretches sunward from the plasmasphere in this image. The three dimensional shape of the plume is complicated, following the magnetic geometry, so that if we follow the plume's 3D shape along the field line, down to the ionosphere, we find that there is an ionospheric signature of the plume, which you can see here in red, and which Dr. Anthea Coster will now discuss.
Slide AC-1 (Anthea Coster)

....
closeupnoplasHR_wdate_Oblique.JPG
??
We have just seen the large-scale changes that are taking place in the earth's plasmasphere during space weather disturbances. What I am now going to talk about are changes that are taking place closer to Earth in the ionosphere during this and other solar storms.
The ionosphere is important because it is the region of the Earth's atmosphere that most affects radio wave propagation. Most people come into contact with the ionosphere when it affects the reception of the AM and FM radio stations that they are listening to or when it affects the navigation solution calculated by their GPS receiver. As scientists, we monitor the ionosphere by measuring what is known as the total electron content or TEC. The TEC is a measure of the total number of electrons that would be contained in a cylinder that extends up vertically above a given point on the earth all the way through the ionosphere. Using signals from GPS satellites, we can measure the TEC. We can do this because the ionosphere is a refractive medium, and therefore changes the speed and direction of travel of the GPS signals. A simple frequency-based relationship allows us to directly measure the TEC by collecting these GPS signals using special scientific receivers. By incorporating data from multiple receivers distributed over the globe, we are able to generate wide-ranging spatial maps of the TEC. An example is shown here, where you can see dramatic features in the TEC that develop over the continental US during geomagnetic storms. Higher than normal TEC values, or TEC enhancements, are indicated in red regions of this figure, and the TEC plume is the narrow feature of the enhanced ionospheric plasma that is moving up from the Northeast US and over into Canada.
Slide AC-2
....
MOVIE...closeupnoplas_wdates_320x240.mpg
??
I am now going to show a
movie
of the development of an ionospheric plume over North America on April 11, 2001, the same storm period that Dr. Jerry Goldstein just discussed.
This movie (closeupnoplas_wdates) shows you the global changes in the TEC during this storm event. The red area indicates the region of the enhanced TEC. The TEC plume is first seen over the northeast US as part of the red area, which indicates high TEC values, is stripped off and moves up from the Northeast US into Canada. (still at 19:10:00 UT 2001 Apr 11). On this day, the plume dies out in the middle of the US and then intensifies again when it reaches the Northwest coast. The apparent motion from east to west indicates that the earth and the GPS receivers are rotating under the TEC plume.
Dr. Goldstein showed the development of plasmaspheric plumes when looking from space down. The GPS TEC data shows ionospheric plasma being moved up from the equatorial regions and then being stripped off into the plasmasphere. The IMAGE data shows the plasma escaping from the plasmasphere and out into space. When you map these features into the same coordinate system, we can show a direct one-to-one correspondence between them. The combination of these new data types allows us to build a picture of how the different regions of the atmosphere respond as a coupled system.
Slide AC-3

....
nov2003HR_wdate_Oblique.1920.JPG
??
** Maybe show 2nd still or movie to illustrate here** We have a second movie/still from November 20, 2003, which was from one of the largest solar storms of the last solar cycle. In this movie/still you can clearly see the plume developing and some of the TEC in the plume moving up into Canada and flowing back over the pole to Europe. The sharp poleward edge of the plume is produced by storm-induced electric fields, which originally develop in the magnetosphere and are imposed on the ionosphere. This gradient in the TEC is a significant space weather feature for users of GPS such as the FAA, the DOT, and the Coast Guard. Dr. Tony Mannucci, who will be speaking next, will explain some of the effects of these large gradients.
Slide AC-4

....
ModelPlumeLatitude.JPG
??
At this meeting, our research group at MIT is reporting on a new automated technique for processing GPS data and on recent statistical analyses that we have performed on many of the storm related features. This is important because we have begun to find repeatable patterns in our data. By cataloging the occurrence of these space weather induced TEC plumes, we are learning why and when these features develop, and the hope is that some day we can predict them for operational users. For example, we have found evidence of a repeatable phenomenon shown in this graph, where the latitude of where the plume forms is shown to be constant as a function of time for three different storm days over two different years. This also matches the pattern observed in earlier work from a single site measured by the MIT radar.
Mention model and predictability.
Our work quantifies understanding of these general ionospheric effects, and we intend to eventually arrive at a better predictive capability for these dramatic space weather events.
Slide AC-5
MOVIE IDEAS
1. ....
pushin_wdates_320x240.mpg
2. ....
CONCEPT
??
In conclusion, I have this last movie to show which unites the plasmaspheric observations/work of Dr. Goldstein with our ionospheric TEC measurements (ASK Jerry which movie). As you can clearly see in this movie, the processes in the two regions, the ionosphere and plasmasphere, are clearly connected. Our understanding of space weather effects acting upon the atmosphere as an entire system is just beginning. Many more ground and space based measurements are needed to fully understand the drivers and implications for the entire ionosphere-thermosphere-magnetosphere system.
Slide TM-1 (Tony Mannucci)

....
rangeplot.JPG

....
aircraft_communication-GPS.JPG
??
There is a huge impact on practical systems from the kinds of events
that Anthea and Jerry are talking about. I want to talk about what
happens to users of the Global Positioning System for applications
such as precision farming, surveying, aviation and general
positioning. The GPS helps users fix their location by triangulating
on ranging signals transmitted from 3+1 GPS satellites whose
locations are known precisely as they orbit the Earth (the fourth
satellite signal compensates for imperfect synchronization of the
receiver clock). These plumes that Anthea showed you impose large
errors on the GPS signals, that can vary quite a bit over just a few
minutes, throwing the user's position off when they least expect it.
This plot shows the rapid range change that occurred during the major
space storm of November 20, 2003 for users in the US. The three
traces are the uncompensated range error between three different
eastern US receivers and a GPS satellite. As you can see, in about 4
minutes, the ranging signal changed by about 20-30 meters (60-90
feet) at one of the locations. This sudden range change causes an
error in the user position, which could reach as high as three times
that, or 90 meters (270 feet or 90 yards!). That is devastating to
civilian users of GPS, for example in automobiles, that rely on GPS
to locate them down to the block and street level. Space storms also
cause problems for aviation users of GPS because when the these large
storms occur, pilots cannot rely on GPS for vertical guidance. If we
could better predict when and how these features appear, we could
make life for the pilots alot easier during these storms.
There are other impacts when these space storms are happening. The
GPS system actually broadcasts at two frequencies, so that certain
sophisticated civilian users with expensive receivers are usually
immune to ionosphere errors. In effect, the second frequency allows
them to measure what the ionosphere is doing to them. However, this
chart shows that these space storms affect these sophisticated users
also, because during these periods of large disturbance, the receiver
cannot maintain lock on both signal frequencies, it's too dynamic,
and more often than not, only a single GPS frequency is trackable.
Here we indicate when the second frequency could not be tracked. So
jobs that require highly precise positioning, such as precision
farming and surveying, are completely interfered with because the
second frequency they rely on is missing--the receiver can't track
the rapid changes. They're back to square one. That's another major
headache associated with these "space storms". Finally, when these
rapid changes are going on, it can create "clutter" in the radars we
use to detect what's just beyond our borders, and certain forms of
military communications. This can affect the US anywhere in the world.
There's largely nothing we can do directly to eliminate the impact
the ionosphere has on these signals. When the space storms are
happening, people will be affected. But what this new science is
telling us is that there is a way to understand the cause of these
disruptions, and possibly to anticipate them: when and where they
will happen. That's a big help for users who are now getting
"blindsided" by the impact of severe space weather and have no idea
what hit them.

